Tag

Metrics Archives - ChangingMedia

The Power of Story

By | Art & Social Change, Art That Counts | No Comments

I was heavily involved and invested in museums for the first decade of my career — as a staff member, a fellow, an intern, a volunteer and a museum studies student. So it was a delight to attend the annual meeting of the American Alliance of Museums in Baltimore this week, greeting the people in the field that I follow avidly via Twitter and blogs and the icons of the museum world to the city of which I’m such a fan.

AAM Schedule (photo by Michelle Gomez)
Photograph of AAM program/schedule courtesy of Michelle Gomez and via Instagram.

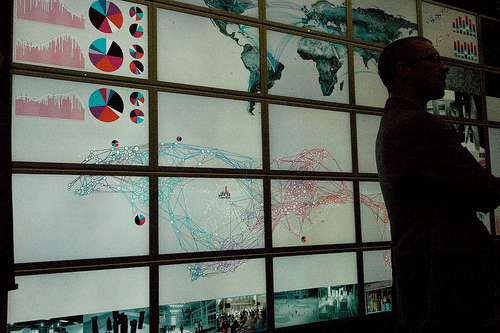
The theme of this year’s conference was “The Power of Story.” And while that might not seem that relevant to data and evaluation on first glance, it’s data that gives power to our stories. Inside museums, evaluation and measurement are done in some ways that might be familiar to the casual visitor (e.g., visitor surveys, comment cards, program evaluations), but also some that might be unexpected or go unnoticed, as a profile from the Wall Street Journal illustrates:

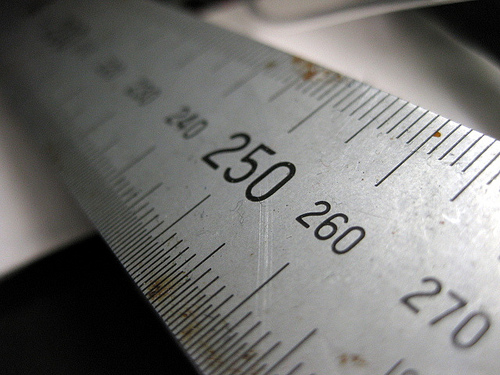
Matt Sikora doesn’t look at the Rembrandts and Rodins at the Detroit Institute of Arts. His eyes are trained on the people looking at them. Mr. Sikora watches where visitors stop, whether they talk or read, how much time they spend. He records his observations in a handheld computer, often viewing his subjects through the display cases or tiptoeing behind them to stay out of their line of sight. “Teenage daughter was with, but did not interact, sat on bench, then left,” read his notes of one visit.

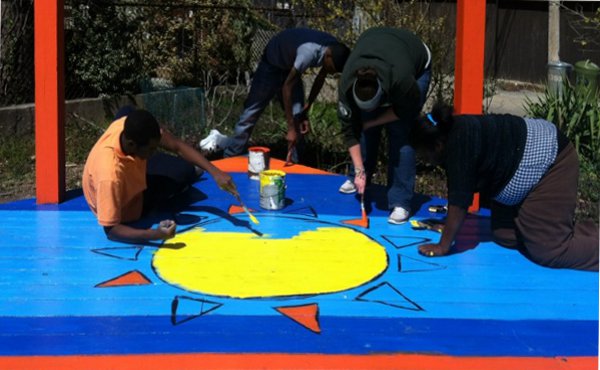
It’s not uncommon for museum evaluators to shadow visitors in the galleries, learning from their movements what areas or objects are engaging and for how long. In addition, before an exhibition opens to the general public, many elements, including label text and interactive gallery displays, are prototyped and tested. Through these evaluations, exhibit designers, curators and museum educators learn more about visitors’ reactions to exhibits: which elements are engaging, confusing or overlooked. In addition, some evaluation tools also provide information about what visitors take away from their time in the gallery — what was learned, what inspired them, what connections they made and, hopefully, what will draw them back again.
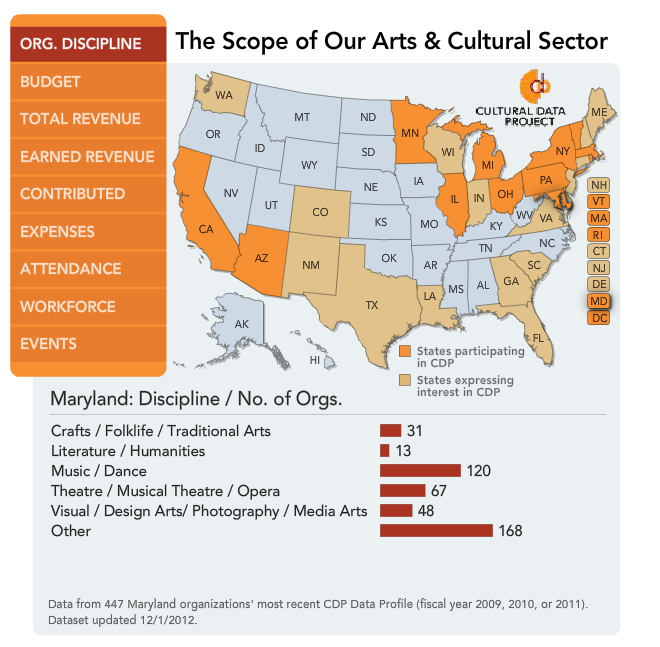
What was so empowering about this year’s conference was being able to evaluate those tools themselves, and to learn. Surprisingly, technology is not always the answer. Visitor evaluation consultants and staff members from the Brooklyn Museum and Monticello shared various scenarios where their attempts to survey visitors went awry because technology got in the way or skewed results, the target audience was elusive or just straight-out avoided their polling attempts. It just goes to show that even bad data can teach you something, even if it’s not what we set out to learn!

Even more surprising was the lesson that data doesn’t necessarily persuade, no matter how clear or comprehensive. Often, beliefs trump facts. As Stephen Bitgood, Professor Emeritus of Psychology at Jacksonville State University and Founder of the Visitor Studies Association, said, “When strong belief is pitted against reason and fact, belief triumphs over reason and fact every time.” Despite our expectation that data should persuade, prove and set people on the right course, it simply doesn’t override gut instinct, what people feel or believe to be true. Again and again, presenters told tales of data being met with questions or disbelief. Unfortunately, no solutions were presented to either circumvent or resolve this issue, but I am filing this under “knowing is half the battle” and keeping it in mind when data is presented as all-powerful or all-knowing.

Display at AAM2013 (photo by Mariel Smith)Display at AAM2013 (photo by Lindsay Smilow)
Photographs of AAM display, top to bottom, courtesy of Mariel Smith via Instagram
and Lindsay Smilow via Instagram.

So evaluation and measurement can fail or go awry. Testing our tools and techniques in small batches prior to rolling out the full survey or other strategy gives us an opportunity to see it in action and identify areas to fix or improve. If evaluation and measurement are treated as afterthoughts, as so often is the case, these tests are even less likely to occur and, as a result, the final data may prove useless, further cementing the idea that evaluation itself is a useless activity. It’s a difficult cycle to break out of, but worth identifying and tackling so that we can truly tell a more powerful story.

Community art

Meaning & Merit in Community Arts

By | Art & Social Change, Art That Counts | No Comments

So much of establishing metrics and evaluations for an organization or program is about asking the right questions and sometimes those questions take you unexpected places. For Rebecca Yenawine and Zoë Reznick Gewanter, their questions have led them on a multi-year research project encompassing not only the outcomes of community art projects, but also illuminating the meaning and merit of the field itself.

Yenawine and Reznick Gewanter are both involved in MICA’s Community Arts program (Yenawine is an adjunct faculty member and community art evaluation consultant and Reznick Gewanter is a graduate of the Masters of Art in Community Art and research assistant for studies through the Office of Community Engagement) and collaborators in the Reservoir Hill-based youth media nonprofit New Lens. In pursuit of useful evaluations for New Lens, the pair realized more contextual research was needed in the area of community art. They’ve designed and are in the process of completing the following three-phase research project:

  • Phase I (2010): Conducted 14 national interviews with community arts practitioners with ten or more years experience.
Chart describing the outcomes of community art

Outcomes of community art cited by current practitioners in the study. Source.

  • Phase II (2012): Interviewed more than 80 youth participants of Baltimore community arts programs.
  • Phase III (ongoing): Studied the impact of community arts programs in five Baltimore neighborhoods (four with active community arts programs, plus four control neighborhoods), collecting 1,000 surveys.

As a whole, this research looks to document the impacts of community art in order to help other practitioners, organizations, communities and funders. This sort of broad multidisciplinary research is rare and provides a benefit to the entire field. In its first two phases, the study provides a common language with which to discuss outcomes in community art, and the final phase includes the development of an assessment tool that can be adapted across organizations and communities. In addition to better describing the outcomes of community arts programs, the research of Yenawine and Reznick Gewanter also challenges practitioners and organizations to invest in evaluations that are specific to the impact and influence of the field and not simply generic metrics. On the Americans for the Arts web site, Yenawine writes:

If art is in fact offering a space for developing social understanding, for connecting and building relationships, and for developing greater cohesion, part of the story that needs to be told is about how and why this is a valuable counterbalance to a society whose bureaucracies emphasize productivity, economic success, and competition without fostering the larger social fabric of communities.

This is really the value of outcomes and metrics. Data is more than numbers in a spreadsheet, charts submitted with reports; at its best, it empowers our descriptions and understanding of our communities, our work and their merit.

IMAGE CREDIT. Photograph courtesy of New Lens.
ruler

Why We Measure

By | Art & Social Change, Art That Counts | No Comments

Moving briefly away from the nitty-gritty of metrics, I want to spend some time on the bigger-picture: namely, why we measure and what is measurable.

Why do we measure results of an art project or nonprofit? Artists and nonprofits seek out metrics for several reasons — to provide required metrics for a grant application or report; to prove that donations were used well; to evaluate programming for renewal or expansion; to establish their successes and shortcomings in achieving their mission.

Basically, these motivations can be divided into two types:

  • because someone else wants the data (e.g., donors, grantmakers, government agencies).
  • because the artist/organization has an interest in self-assessment.

In the case of the former, groups have little to no investment in the data itself, only in the outcome. In the latter, however, the motivation to establish the value of the organization or project indicates an investment in what is measured and the story that can be told using that data. (Also, as I wrote previously, frustration with the metrics required by funders can result in organizations getting invested in adopting metrics relevant to their specific mission and programs.)

As Andrew Taylor wrote recently,

If you care internally about good decisions, and metrics will help you (and they will, if they’re specific), then measure. If you are specifically aware of external value that will flow your way if you can express your impact in specific ways, then measure. If neither of these is true, then really, don’t bother. Measuring won’t make a measurable difference.

Measuring for the sake of measurement sends you down a rabbit hole of wasted time and energy. In order to achieve metrics that are worthwhile and reliable, requires establishing goals, monitoring/soliciting data, sorting and analyzing the data and sharing it with stakeholders/leaders. These are not simple tasks, as highlighted by Bill Gates in his 2013 Annual Letter for the Bill and Melinda Gates Foundation:

You can achieve amazing progress if you set a clear goal and find a measure that will drive progress toward that goal-in a feedback loop […]. This may seem pretty basic, but it is amazing to me how often it is not done and how hard it is to get right. […]  I think a lot of efforts fail because they don’t focus on the right measure or they don’t invest enough in doing it accurately.

But what’s the right measure? And what is actually measurable? It’s fairly common for nonprofits and community art projects to be able to establish some basic facts and figures relating to attendance, demographics, and dollars raised. Sometimes these are enough to demonstrate impact or value in a short-term way, but, in general, the results side of nonprofits remains complex and difficult to measure. Just as website analytics have evolved beyond mere clicks and page views to developing a relationship ladder (e.g., converting visitors into subscribers), nonprofits should be willing to investigate and pillage the metrics used by other industries:

All efforts can benefit from these approaches — in both looking beyond our immediate sphere for inspiration, and in stepping back and asking exactly why we want to measure in the first place.

IMAGE CREDIT. CC photo via Flickr user cAtdraco.
HIPerwall Demo: Cultural Analytics by Flickr user guategringo

Big Data Meets Art

By | Art & Social Change, Art That Counts | 2 Comments

Big data isn’t something that’s just being covered breathlessly by the likes of Forbes and Fast Company; arts and culture organizations and nonprofits are generating, collecting and sifting through their own data and collaborating to make sense of it all. Initiatives like the Cultural Data Project (CDP) and the National Arts Index have been collecting and sharing data since 2004 and 1998 respectively (check out Baltimore’s Local Arts Index).

The CDP is an online tool which allows arts and cultural organizations to report, review and analyze organizational, programmatic and financial data. Originally developed through a collaboration of Pennsylvania funders, the project expanded to other states beginning in 2007 with Maryland. It now includes 12 states and the District of Columbia. Locally, Maryland State Arts Council is a member of the Maryland CDP Task Force and requires many grantseekers to complete a CDP organizational profile. More than 14,000 arts and cultural organizations have completed a profile, including 447 Maryland organizations (as of December 1st, 2012).

Screenshot from 2013-03-13 19:35:58

This data collection process results in reliable longitudinal data that is useful to researchers and advocates, as well as grant makers and the participant organizations. Participants can run and download reports that compare their activity from year to year, as well as comparisons against data aggregated by other participating organizations on the basis of organization type, geography and budget size.

While it has been run and organized by The Pew Charitable Trusts for the past eight years, the project is currently in transition and will begin operating as an independent nonprofit as of April 1st, 2013. In addition, it announced a collaboration with the arts and business schools at Southern Methodist University (SMU) and other partners to create a National Center for Arts Research (NCAR) at SMU. Together, these organizations look to be a nationwide resource on arts attendance and patronage, the impact of the arts in our communities and the financial trends and health of arts nonprofits. This new center will build upon the comparison reports currently available via the CDP:

NCAR will maintain a website with an interactive “dashboard,” created in partnership with IBM, which will be accessible to arts organizations nationwide. Arts leaders will be able to enter information about their organizations and see how they compare to the highest performance standards for similar organizations in areas such as community engagement, earned and contributed revenue, and balance sheet health.

The current shortcomings and the future potential of the CDP have been outlined in a great article by Talia Gibas and Amanda Keil. Issues such as this were much on my mind as I attended the Greater Baltimore Cultural Alliance (GBCA)’s gathering of cultural data collectors. While the original invite and some of the presentations focused on mapping data, a broader conversation also took place about the challenges local arts nonprofits face when collecting and analyzing data. I was actually delighted that representatives of the Baltimore tech community (Sharon Paley of the Greater Baltimore Technology Council and Kate Bladow, coordinator of the Tech and Social Change meetup) were attending and a partnership with GBTC has resulted.

There was some discussion that an ongoing group would meet around these issues and, should that come to fruition, I look forward to the opportunity to participate further and meet more individuals involved in the arts and nonprofits who are looking for data-driven answers about the impact of their work. One of my major takeaways from this session, however, was that my consideration of data shouldn’t be limited to metrics of impact, but also the power of data to describe our community. I look forward to highlighting some of this work already ongoing in Baltimore in future columns.

Toward a Better World

By | Social Enterprise, The Thagomizer | No Comments

Recently I was at a breakfast with social entrepreneurs where we were asked “what do we mean by a ‘better Baltimore?'” It is something we all talk about, it’s embedded in the mission statements of our companies and nonprofits, but what does a better Baltimore actually look like? Happier people? Economic opportunity for all? Healthier physical, emotional, and social well being?

For that matter what do we mean by a “better world?” What are the metrics for determining whether or not we are effectively improving lives or if we are changing anything at all?  This question was first voiced by Angelique and it resonates with all of the work we discuss on ChangeEngine. How can we tell whether anything we promote, propose, point out, or implement actually has an effect on the community?

The social change field has gotten better at determining organizational impact. Every nonprofit nowadays seems to be working on a logic model or theory of change. However I think in order to truly measure impact effectively we need a universal measure that:

  • is a relatively objective system of measurement that allows us to effectively compare models of social change and determine failure as well as success.
  • examines the whole person and allows for collaboration. People don’t live in silos. Food effects education which effects economic opportunity, etc. In the end what makes a person or a community better and how do we measure that end result?
  • allows us to track social change trends for communities, cities, countries, and the world.

In the economic sphere of social change the universal measure is profit. I think profit has become the bottom line for most of our work because we believed in the American dream, a theory of change that suggested by increasing profit we could increase our purchasing power which would allow us to access the innovations that would make our lives easier and thus make us happier people. If you’ve read my other blogs here, you’ll know that I don’t think that’s true. I think there are ways to meet our needs without money and I think happiness isn’t measured purely by one’s bank account.

Yet the question of what we should measure is as difficult as trying to determine the meaning of life. Then you have the Herculean task of trying to figure out how to measure it.

There have been some attempts. Many people are familiar with the Bhutanese  system to combine measures of spiritual and material development into a measure called Gross National Happiness (GNH). in 2006, Med Jones of the International Institute of Management proposed a second-generation GNH measure that used the following metrics to determine happiness:

  1. Economic wellness: Indicated via direct survey and statistical measurement of economic metrics such as consumer debt, average income to consumer price index ratio and income distribution.
  2. Environmental wellness: Indicated via direct survey and statistical measurement of environmental metrics such as pollution, noise and traffic.
  3.  Physical wellness: Indicated via statistical measurement of physical health metrics such as severe illnesses.
  4.  Mental wellness: Indicated via direct survey and statistical measurement of mental health metrics such as usage of antidepressants and rise or decline of psychotherapy patients.
  5. Workplace wellness: Indicated via direct survey and statistical measurement of labor metrics such as jobless claims, job change, workplace complaints and lawsuits.
  6. Social wellness: Indicated via direct survey and statistical measurement of social metrics such as discrimination, safety, divorce rates, complaints of domestic conflicts and family lawsuits, public lawsuits, crime rates.
  7. Political wellness: Indicated via direct survey and statistical measurement of political metrics such as the quality of local democracy, individual freedom, and foreign conflicts.

Another measure is called National Accounts of Well Being, developed by the New Economy Foundation. They use the scientific definition of “subjective well-being” which suggests in addition to experiencing good feelings people need:

  • a sense of individual vitality
  • to undertake activities which are meaningful, engaging, and which make them feel competent and autonomous
  • a stock of inner resources to help them cope when things go wrong and be resilient to changes beyond their immediate control.

They also believe that it is crucial that people feel a sense of relatedness to other people so in addition to measuring the individual aspects of well-being they also look at the degree of which people have supportive relationships and a sense of connection with others. They have identified seven main components of well being which they measure using national Well-Being profiles.

These measures are just two examples of systems that have the potential to help us define the end result of social change and measure our effect on people and communities.

And now a word from our sponsors…If you have been waiting for a chance to meet me in person your time has come. I will be the Mesh Baltimore Skillshare on March 2 waxing poetic on “How to Bring Your Quirk to Social Media.” After you pump me for information on creating a wacky, bizarre, and totally awesome social media presence, you can attend sessions on writing about food, organizing your life, and homebrewing. Check out Mesh Baltimore and sign up for the Skillshare here.

But wait there’s more! I’m teaming up with UGive.org for a Tweet Chat on “Marketing Your Social Enterprise” on March 6th at 3pm EST. If you share my passion for social enterprise you will not want to miss this discussion! Sign up using EventBrite or just join us using the hashtag #HowDoUGive.


IMAGE CREDIT. Courtesy of mlcastle.

Creative Arithmetic

By | ChangeEngine | 2 Comments

It’s funny what can emerge from a conversation. That, as a matter of fact, is a central premise of CreateBaltimore – the free-form conclave of Baltimore’s creative minds that seeks to go beyond pontification and spark powerful action. (Hmm, must have the pope on my mind.) ChangeEngine‘s own bard of Love & Concrete, Scott Burkholder, is both a co-creator and driving force behind the annual event, which had its most recent incarnation last Saturday, and naturally we want to use our platform to both cover and catalyze the process. But how do you capture the dizzying energy of those few short hours for those who created it, and convey that energy to those who weren’t there? And how do you start to quantify the impact of an “Un-Conference”? What are the metrics of imagination and passion?

Scott came to us with some intriguing figures. They lay a little flat as simple lines of text but got us excited enough to create this infographic. “That’s great,” said Scott. “But could we show how ninety percent of the sponsors were also participants.” And so we created another.

From words to vision to action – the CreateBaltimore way. Here’s to keeping the creative pistons firing…

CreateBaltimoreCreativeArithmetic - ChangingMedia

CreateBaltimoreDonutChart - ChangingMedia

Metrics for Joy and Life

By | Art & Social Change, Art That Counts | No Comments

Many art programs and projects exist because they seem like good ideas — some because they made good use of an existing space, others because they have good intentions to draw attention to or even solve a community problem. As an example, I present the missions of two now-defunct Baltimore projects:

  1. Operation: Storefront: To match landlords of vacant spaces with tenants to fill space and create life on the street.
  2. Black Male Identity Project (BMI): [To serve] as a catalyst for a national campaign to build, celebrate, and accentuate positive, authentic images and narratives of black cultural identity.

Both of these projects had laudable goals. But there can be substantial difficulty in evaluating the successes and failures in achieving such goals. What does it mean to be a catalyst on a national level or for there to be “life” on a street? Furthermore, how should these things be measured? What can they be compared to?

Evaluations such as this are often considered as an afterthought and usually as an angst-inducing or frustrating rite of passage to receive funding. Clayworks’ founder, Deborah Bedwell, once wrote:

…when I would see the words ‘measurable outcomes’ on a grant proposal, I would experience a wave of nausea and anxiety. I would be required, the grant stated, to prove to the prospective funder that our programs and activities had created a better life for those who touched clay and for the rest of the city — and maybe the rest of humanity.

So, just as an organization or project’s mission and goals can be far reaching and even dramatically overstated, the bar for measurement can also seem impossibly high. In an effort to create one-size-fits-all metrics, some have focused on the most obvious and simple things to identify and measure — such as attendance or economic impact. For some organizations and projects, even these metrics can be challenging. For example, how should the attendance to a mural or other public work of art be estimated? Some sites are using QR codes to track visits, but the necessity of smartphones is an obvious limitation to the resulting data. Some funders have developed their own gauges, such as ArtPlace’s vibrancy indicators, in an effort to create a level playing field among grantseekers and with a hope to create a more useful and larger pool of results data from their activities.

In the case of Clayworks, Bedwell was interested in capturing and communicating something beyond raw numbers about participation in their community arts program and saw the need to “figure out how to evaluate joy, how to measure creativity, and how to quantify that ‘I get it!’ moment that makes weeks of hard work worth the effort.” While many might give up before they started on such an effort, Clayworks received assistance from the Maryland Association of Nonprofits in tackling their evaluation dilemma; they adopted a model used by The Kellogg Foundation, which Bedwell described enthusiastically in an article for the NEA’s web site (Note: This article is no longer online, but is available as a PDF download. All Bedwell’s quotes are originally from this article.).

So, if one can measure the joy found in creating, then it is likely also possible to measure — with adequate thought and planning — the “life” or vibrancy of a street or neighborhood, the changes in attitudes inspired by a photograph or a lecture. It’s important for these challenging metrics to be tackled and shared, not just so funders can identify return on investment, but so artists and communities can benefit, be able to point to their successes, to know which efforts are worth continuing and repeating.

I plan on diving into this in even greater detail in future posts, as well as continuing to highlight existing art projects and their impact. If you want to share some insights about your organization or project, I invite you to join me in the comments or to reach out to me via Twitter or email.

Noteworthy:

If you are inspired by or involved in the intersection of arts, culture and community, these upcoming events may be worth your time to check out:


PHOTO CREDIT. Photo of entrance to the Franklin Building in Chicago by Flickr user Terence Faircloth/Atelier Teee.

If Public Art Can’t Reduce Crime, What Good Is It to Society?

By | Art & Social Change, Of Love and Concrete, Social Media | No Comments

Recently the Social Enterprise Alliance hosted a summit on metrics and impact. The day-long event featured speakers contemplating how to measure change. More specifically the event asked how we determine if an organization is creating the change that it purports to be making.

The event got me thinking about art organizations. Many creative organizations are designated as 501(c)3 non-profit entities. The status is given to a business based on it working for the benefit of the public not an individual. (Check out IRS language for specifics) I know that art is good for society but how does a non-profit arts organization demonstrate that the work that it is doing is good for society? What are metrics that we can use to demonstrate our impact?

Fortunately, the Baltimore Love Project, a city-wide street art project, has gone through many trials. One of my “fondest” memories made during the project was sitting in a prolific Baltimore foundation’s offices. It was one of my first pitches to a significant investor. He had the means to pay for the entire project. Trial by fire was an understatement. Despite our passion, we were not prepared to articulate a change that was of interest to him. He pretty much asked us how many kids would graduate from high school and go to college as a result of our work. We not only didn’t know the answer, we had no response. We learned that day that we need something tangible for people to see the value of our work. We needed metrics. We walked away with no money but an important lesson.

Since that conversation we have figured out what we are doing besides painting beautiful images on the sides of buildings. We have come to define our social value in three ways. First we are aesthetically changing the face of 20 communities. Second, we are putting Baltimore on the map as a destination to visit. Third, we are changing the philosophy of individuals.

The first change is obvious but important to note. We are physically changing the way our city looks. It is simple to measure. We can point to the mural on a wall or show photographs of the work. What is harder, and just as important, is to show that the change is positive. We have achieved that with thousands of people through social media and elsewhere espousing love for the murals. The second change is also important. We want people inside and out to see that Baltimore is more than HBO’s The Wire. Our metric for this comes in the form of content created. How many stories are being told about the Love project and where? We have a list of over 45 platforms that have shared our work. On top of that, we also have a catalog of responses from folks that are impressed with the city simply because something like the love project is happening here.

The final change is probably the most powerful. Art is meaningful because it can change philosophy. To measure this we are tracking two things in particular. The first is our presence at events in the community. We have explored philosophy on over 75 occasions in the past two years with over 3,000 people directly and 125,000 indirectly. The events range from large scale street festivals, to intimate three-hour conversations with a college class. You may be thinking that talking is not necessarily a sign of a changed mind. We agree. We are also tracking action that has happened as a result of the project. We have dozens of examples of individuals DOING SOMETHING as a result of the work. It is as simple as individuals empowered to tour Baltimore with murals as their beacons, or as intense as a couple reconsidering how they fight.

Over time we have learned how to describe our value. Our metrics are likely not complete nor perfect but have become very important to us. They help us understand the value of our project but more importantly they help others understand why a future where every wall is a canvas and every street corner is a gallery is a future worth pursuing.